1.2.3
Comparing Hazards
Test your knowledge with free interactive questions on Seneca — used by over 10 million students.
Measuring the Intensity of Tectonic Hazards
The magnitude and intensity of tectonic hazards are measured using a variety of different scales.
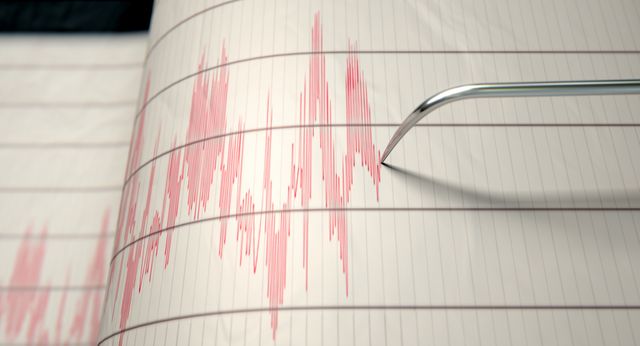
Earthquake magnitude
- The amount of energy released is measured by the Moment Magnitude Scale (MMS), which is a version of the old Richter scale.
- The MMS goes from 1 to 10, with a higher number meaning greater magnitude.
- The scale is also logarithmic. This means that an increase of 1 unit of magnitude increases the amount of shaking by 10, but the amount of energy released by 30.
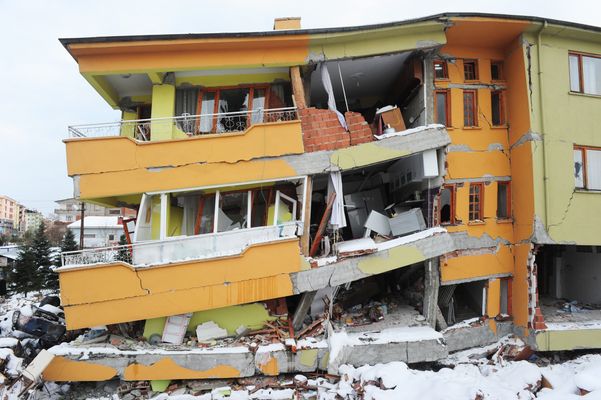
Earthquake damage
- The damaging effects of earthquakes are measured by the Mercalli scale.
- The Mercalli scale measures the intensity of shaking on a scale of 1 to 12 (usually given as Roman numerals).

Volcano magnitude
- Volcano magnitude is measured by the Volcanic Explosivity Index (VEI).
- The VEI is based on the volume, duration and column height of eruptions.
- The explosivity is related to the type of magma and the type of plate boundary that the volcano is located on.

VEI examples
- Effusive eruptions of basaltic lavas with low VEI (0 to 3) normally happen on constructive boundaries.
- Explosive eruptions with high VEI (4 to 7) happen on destructive boundaries.
Hazard Profiles
Hazard profiles can be used to compare the characteristics of tectonic hazards.

What do hazard profiles show?
- Hazard profiles summarise the physical processes shared by all hazards so that decision-makers can determine which areas are most at risk.
- Hazard profiles show how different types of hazards vary in:
- Magnitude.
- Speed of onset.
- Areal extent (the area that will be affected).
- Duration.
- Frequency.
- Spatial predictability.

High-risk events
- Events which present the highest risk have:
- High magnitudes.
- Low frequencies.
- Rapid speeds of onset.
- Low spatial predictability.
- Large areal extents.
- These high-risk events happen mostly at subduction and collision zones.
2005 Kashmir Earthquake
Kashmir, in Northern India, was hit by a severe earthquake in 2005, killing at least 79,000 people.
Hazard profile
- A high magnitude (MMS 7.6) earthquake hit Kashmir in 2005, with a ground-shaking intensity of VII (severe).
- The speed of onset was very rapid, so there was a limited chance of evacuating to a safe area.
- Damage was centred on Muzaffarabad but spread over a large area of more than 1000 km2
- Ground shaking lasted 30–45 seconds (a short duration), but landslides triggered by the earthquake continued for some time, as did aftershocks up to magnitude MMS 6.4.

Hazard profile cont.
- Earthquakes don't hit Kashmir often. The previous major earthquake in Kashmir was in 1905, so there was no ‘collective memory’ of the risks and impacts of earthquakes in the region.
- Spatial predictability was low. Kashmir is in a ‘seismic gap’, i.e. an area of known risk that had not experienced an earthquake for some time.
1Tectonic Processes & Hazards
1.1Tectonic Processes & Hazards
1.2Natural Disasters
1.3Natural Disaster Case Studies
1.4Trends & Patterns
2Option 2A: Glaciated Landscapes & Change
2.1Glaciated Landscapes Over Time
2.2Periglacial Landscapes
2.3Glacial Processes
2.4Glacial Landforms
3Option 2B: Coastal Landscapes & Change
3.1Coastal Landscapes
3.2Coastal Erosion & Deposition
3.3Coastal Risks
4Globalisation
4.1Globalisation
4.2Negatives of Globalisation
4.3Global Shift
4.5Culture
4.6Measuring Development
5Option 4A: Regenerating Places
5.1Types of Economies
5.2Function of Places
5.3Regeneration
5.4Regeneration Case Studies
6Option 4B: Diverse Places
6.1Population Structure
6.2Past & Present Connections
6.3Urban & Rural Spaces
6.4Diversity
6.5Urban & Rural Case Studies
6.6Case Study - Tower Hamlets
6.7Case Study - Sturton-le-Steeple
7The Water Cycle & Water Insecurity (A2 only)
7.1Hydrological Processes Global to Local
7.2Influences on the Water Cycle
7.3Water Insecurity
8The Carbon Cycle & Energy Security (A2 only)
8.1The Carbon Cycle
8.2Energy Consumption
8.3Alternative Energy
8.4Growing Demand for Resources
9Superpowers (A2 only)
9.1Superpowers
9.2Hard & Soft Power
9.2.1Hard & Soft Power9.2.2Emerging Powers - China Rivalry9.2.3Emerging Powers - Chinese Sources of Power9.2.4Emerging Powers - Brazil9.2.5Emerging Powers - Russia9.2.6Emerging Powers - India9.2.7Theories of Development9.2.8Power Case Studies: Chinese One Belt One Road9.2.9Power Case Studies: Pakistan Nuclear Arms9.2.10Power Case Studies: OPEC
9.3IGOs, TNCs & Alliances
10Option 8A: Health & Human Rights (A2 only)
10.1Human Development
10.2Role of Governments & IGOs
10.3Human Rights
10.4Interventions
11Option 8B: Migration & Identity (A2 only)
11.1Globalisation & Migration
11.2Consequences of Migration
11.3Nation States
11.4Responses to Global Migration
Jump to other topics
1Tectonic Processes & Hazards
1.1Tectonic Processes & Hazards
1.2Natural Disasters
1.3Natural Disaster Case Studies
1.4Trends & Patterns
2Option 2A: Glaciated Landscapes & Change
2.1Glaciated Landscapes Over Time
2.2Periglacial Landscapes
2.3Glacial Processes
2.4Glacial Landforms
3Option 2B: Coastal Landscapes & Change
3.1Coastal Landscapes
3.2Coastal Erosion & Deposition
3.3Coastal Risks
4Globalisation
4.1Globalisation
4.2Negatives of Globalisation
4.3Global Shift
4.5Culture
4.6Measuring Development
5Option 4A: Regenerating Places
5.1Types of Economies
5.2Function of Places
5.3Regeneration
5.4Regeneration Case Studies
6Option 4B: Diverse Places
6.1Population Structure
6.2Past & Present Connections
6.3Urban & Rural Spaces
6.4Diversity
6.5Urban & Rural Case Studies
6.6Case Study - Tower Hamlets
6.7Case Study - Sturton-le-Steeple
7The Water Cycle & Water Insecurity (A2 only)
7.1Hydrological Processes Global to Local
7.2Influences on the Water Cycle
7.3Water Insecurity
8The Carbon Cycle & Energy Security (A2 only)
8.1The Carbon Cycle
8.2Energy Consumption
8.3Alternative Energy
8.4Growing Demand for Resources
9Superpowers (A2 only)
9.1Superpowers
9.2Hard & Soft Power
9.2.1Hard & Soft Power9.2.2Emerging Powers - China Rivalry9.2.3Emerging Powers - Chinese Sources of Power9.2.4Emerging Powers - Brazil9.2.5Emerging Powers - Russia9.2.6Emerging Powers - India9.2.7Theories of Development9.2.8Power Case Studies: Chinese One Belt One Road9.2.9Power Case Studies: Pakistan Nuclear Arms9.2.10Power Case Studies: OPEC
9.3IGOs, TNCs & Alliances
10Option 8A: Health & Human Rights (A2 only)
10.1Human Development
10.2Role of Governments & IGOs
10.3Human Rights
10.4Interventions
11Option 8B: Migration & Identity (A2 only)
11.1Globalisation & Migration
11.2Consequences of Migration
11.3Nation States
11.4Responses to Global Migration
Practice questions on Comparing Hazards
Can you answer these? Test yourself with free interactive practice on Seneca — used by over 10 million students.
- 1What does MMS stand for?Multiple choice
- 2Which of the following are earthquake scales?True / false
- 3What magnitude and frequency would a high-risk event have?Multiple choice
- 4
- 5What is shown in this diagram?Multiple choice
Unlock your full potential with Seneca Premium
Unlimited access to 10,000+ open-ended exam questions
Mini-mock exams based on your study history
Unlock 800+ premium courses & e-books