5.1.6
Photosynthesis Experiments
Using Chromatography to Investigate Photosynthesis
Using Chromatography to Investigate Photosynthesis
Chromatography is a technique that can be used to identify which pigments are in the leaves of different plants. This allows us to identify what wavelengths of light a plant can absorb.

1) Extract the chlorophyll
1) Extract the chlorophyll
- Take some leaves from a plant that grows in the shade.
- Place boiling water from a kettle into a beaker and dip a few leaves to kill them.
- Tear up the leaves and grind with 5-10 cm3 of acetone in a pestle and mortar until you obtain a dark green chlorophyll extract. Add a pinch of sand to break up the cells.
 8.1.3.1 - Paper chromatography apparatus,h_400,q_80,w_640.jpg)
2) Add the chlorophyll
2) Add the chlorophyll
- Use a strip of chromatography paper, which fits into a boiling tube without touching the sides. Mark a line 1.5 cm from the bottom in pencil and in the centre put a cross.
- Mark another line 2 cm from the top of the paper.
- Pick up your chlorophyll solution using a capillary tube and place on the cross. Allow to dry.
- Repeat 4-5 times to have a small, dense green spot.

3) Suspend the paper
3) Suspend the paper
- Put 1.5 cm of acetone/petroleum solvent into the bottom of the boiling tube, using a funnel to avoid wetting the sides.
- Suspend the paper using a drawing pin so that it just touches the solvent and leave.

4) Repeat the experiment
4) Repeat the experiment
- Repeat steps 1-3 using leaves from a plant that grows well in direct sunlight.
- Remove the paper from each boiling tube when the solvent reaches the line at the top of the papers. Mark the positions of the pigments before they fade.

5) Calculate Rf
5) Calculate Rf
- Calculate the Rf values using:
- Rf = distance travelled by spot ÷ distance travelled by solvent
- Find the pigment that corresponds with the given Rf value.
Investigating Dehydrogenase Activity in Chloroplasts
Investigating Dehydrogenase Activity in Chloroplasts
During the light-dependent reaction, NADP is reduced to NADPH. A dehydrogenase enzyme catalyses this reaction. This experiment will monitor dehydrogenase activity by using DCPIP, a redox indicator.
DCPIP
DCPIP
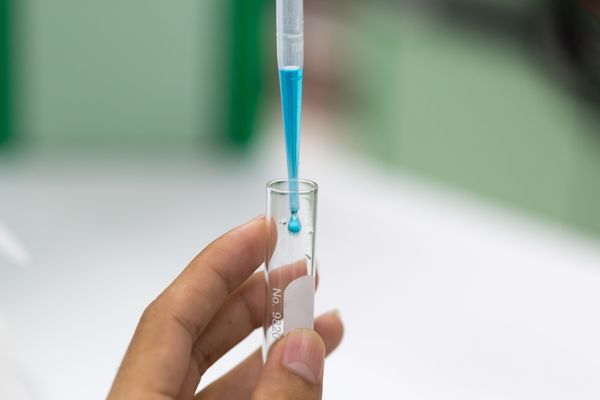
- In this investigation, a blue dye (DCPIP) is used to monitor the rate of dehydrogenase activity. DCPIP is a redox indicator.
- This means that it is blue in the oxidised state and colourless in its reduced state.
- When electrons are released by the chlorophyll, DCPIP will change from blue to colourless.

1) Extracting chloroplasts
1) Extracting chloroplasts
- Put 50 cm3 of isolation medium into a beaker.
- Tear eight spinach leaves into small pieces and put the pieces into the isolation medium in the beaker.
- Do NOT put pieces of the midrib or the leaf stalk into the beaker.
- Half fill a large beaker with ice and place a small beaker on top of the ice.
- When carrying out this step, all solutions and apparatus should be kept as cold as possible and the extraction should be carried out as quickly as possible.

2) Suspending chloroplasts
2) Suspending chloroplasts
- Put 3 layers of muslin over the top of the filter funnel and wet with the isolation medium. Rest the filter funnel in the small beaker on the ice.
- Pour the spinach and isolation medium into the blender and blend for 15 seconds. Pour the blended mixture back into the beaker.
- Pour your blended mixture through the muslin in the filter funnel. Carefully squeeze the muslin to assist the filtering process.
- Label this filtrate which is in the small beaker on ice as ‘chloroplast suspension’.

3) Set up tubes A and B
3) Set up tubes A and B
- Label five test tubes A, B, C, X and Y and stand them in the large beaker. Put the lamp about 10 cm away so that all tubes are illuminated. Set up tubes A and B as follows:
- Tube A - 5 cm3 DCPIP solution + 1 cm3 water + 1 cm3 chloroplast suspension. Immediately wrap the tube in aluminium foil to exclude light.
- Tube B - 5 cm3 DCPIP solution + 1 cm3 water + 1 cm3 isolation medium.
- Tubes A and B are control experiments. Leave both tubes until the end of your investigation.
4) Set up tube C
4) Set up tube C
- Set up tube C as follows:
- Tube C - 6 cm3 water + 1 cm3 chloroplast suspension.
- Tube C is for you to use as a standard to help you to determine when any colour change is complete.

5) Set up tube X
5) Set up tube X
- Set up tube X as follows:
- Tube X - 5 cm3 DCPIP solution + 1 cm3 water in the tube.
- Add 1 cm3 chloroplast suspension to tube X, quickly mix the contents and start the timer.
- Record in seconds how long it takes for the contents of tube X to change colour from blue-green to green. Use tube C to help you determine when the colour change is complete.
- Repeat this step four more times.
6) Set up tube Y
6) Set up tube Y
- Set up tube Y as follows:
- Tube Y - 5 cm3 DCPIP solution + 1 cm3 ammonium hydroxide.
- Add 1 cm3 chloroplast suspension to tube Y, quickly mix the contents and start the timer.
- Record in seconds how long it takes for the contents of tube Y to change colour from blue-green to green. Use tube C to help you determine when the colour change is complete.
- Repeat this step four more times.

7) Record the results
7) Record the results
- Record your data in a suitable table.
- At the end of your investigation, record the colour of the mixtures in tubes A and B.
1Biological Molecules
1.1Monomers & Polymers
1.2Carbohydrates
1.3Lipids
1.4Proteins
1.4.1The Peptide Chain
1.4.2Investigating Proteins
1.4.3Primary & Secondary Protein Structure
1.4.4Tertiary & Quaternary Protein Structure
1.4.5Enzymes
1.4.6Factors Affecting Enzyme Activity
1.4.7Enzyme-Controlled Reactions
1.4.8End of Topic Test - Lipids & Proteins
1.4.9A-A* (AO3/4) - Enzymes
1.4.10A-A* (AO3/4) - Proteins
1.5Nucleic Acids
1.8Inorganic Ions
2Cells
2.1Cell Structure
2.2Mitosis & Cancer
2.3Transport Across Cell Membrane
3Substance Exchange
3.1Surface Area to Volume Ratio
3.2Gas Exchange
3.3Digestion & Absorption
4Genetic Information & Variation
4.1DNA, Genes & Chromosomes
4.2DNA & Protein Synthesis
4.3Mutations & Meiosis
4.4Genetic Diversity & Adaptation
4.5Species & Taxonomy
4.6Biodiversity Within a Community
4.7Investigating Diversity
5Energy Transfers (A2 only)
5.1Photosynthesis
5.2Respiration
5.3Energy & Ecosystems
6Responding to Change (A2 only)
6.1Nervous Communication
6.2Nervous Coordination
6.3Muscle Contraction
6.4Homeostasis
6.4.1Overview of Homeostasis
6.4.2Blood Glucose Concentration
6.4.3Controlling Blood Glucose Concentration
6.4.4End of Topic Test - Blood Glucose
6.4.5Primary & Secondary Messengers
6.4.6Diabetes Mellitus
6.4.7Measuring Glucose Concentration
6.4.8Osmoregulation
6.4.9Controlling Blood Water Potential
6.4.10ADH
6.4.11End of Topic Test - Diabetes & Osmoregulation
6.4.12A-A* (AO3/4) - Homeostasis
7Genetics & Ecosystems (A2 only)
7.1Genetics
7.2Populations
7.3Evolution
7.3.1Variation
7.3.2Natural Selection & Evolution
7.3.3End of Topic Test - Populations & Evolution
7.3.4Types of Selection
7.3.5Types of Selection Summary
7.3.6Overview of Speciation
7.3.7Causes of Speciation
7.3.8Diversity
7.3.9End of Topic Test - Selection & Speciation
7.3.10A-A* (AO3/4) - Populations & Evolution
8The Control of Gene Expression (A2 only)
8.2Gene Expression
8.2.1Stem Cells
8.2.2Stem Cells in Disease
8.2.3End of Topic Test - Mutation & Gene Epression
8.2.4A-A* (AO3/4) - Mutation & Stem Cells
8.2.5Regulating Transcription
8.2.6Epigenetics
8.2.7Epigenetics & Disease
8.2.8Regulating Translation
8.2.9Experimental Data
8.2.10End of Topic Test - Transcription & Translation
8.2.11Tumours
8.2.12Correlations & Causes
8.2.13Prevention & Treatment
8.2.14End of Topic Test - Cancer
8.2.15A-A* (AO3/4) - Gene Expression & Cancer
8.3Genome Projects
Jump to other topics
1Biological Molecules
1.1Monomers & Polymers
1.2Carbohydrates
1.3Lipids
1.4Proteins
1.4.1The Peptide Chain
1.4.2Investigating Proteins
1.4.3Primary & Secondary Protein Structure
1.4.4Tertiary & Quaternary Protein Structure
1.4.5Enzymes
1.4.6Factors Affecting Enzyme Activity
1.4.7Enzyme-Controlled Reactions
1.4.8End of Topic Test - Lipids & Proteins
1.4.9A-A* (AO3/4) - Enzymes
1.4.10A-A* (AO3/4) - Proteins
1.5Nucleic Acids
1.8Inorganic Ions
2Cells
2.1Cell Structure
2.2Mitosis & Cancer
2.3Transport Across Cell Membrane
3Substance Exchange
3.1Surface Area to Volume Ratio
3.2Gas Exchange
3.3Digestion & Absorption
4Genetic Information & Variation
4.1DNA, Genes & Chromosomes
4.2DNA & Protein Synthesis
4.3Mutations & Meiosis
4.4Genetic Diversity & Adaptation
4.5Species & Taxonomy
4.6Biodiversity Within a Community
4.7Investigating Diversity
5Energy Transfers (A2 only)
5.1Photosynthesis
5.2Respiration
5.3Energy & Ecosystems
6Responding to Change (A2 only)
6.1Nervous Communication
6.2Nervous Coordination
6.3Muscle Contraction
6.4Homeostasis
6.4.1Overview of Homeostasis
6.4.2Blood Glucose Concentration
6.4.3Controlling Blood Glucose Concentration
6.4.4End of Topic Test - Blood Glucose
6.4.5Primary & Secondary Messengers
6.4.6Diabetes Mellitus
6.4.7Measuring Glucose Concentration
6.4.8Osmoregulation
6.4.9Controlling Blood Water Potential
6.4.10ADH
6.4.11End of Topic Test - Diabetes & Osmoregulation
6.4.12A-A* (AO3/4) - Homeostasis
7Genetics & Ecosystems (A2 only)
7.1Genetics
7.2Populations
7.3Evolution
7.3.1Variation
7.3.2Natural Selection & Evolution
7.3.3End of Topic Test - Populations & Evolution
7.3.4Types of Selection
7.3.5Types of Selection Summary
7.3.6Overview of Speciation
7.3.7Causes of Speciation
7.3.8Diversity
7.3.9End of Topic Test - Selection & Speciation
7.3.10A-A* (AO3/4) - Populations & Evolution
8The Control of Gene Expression (A2 only)
8.2Gene Expression
8.2.1Stem Cells
8.2.2Stem Cells in Disease
8.2.3End of Topic Test - Mutation & Gene Epression
8.2.4A-A* (AO3/4) - Mutation & Stem Cells
8.2.5Regulating Transcription
8.2.6Epigenetics
8.2.7Epigenetics & Disease
8.2.8Regulating Translation
8.2.9Experimental Data
8.2.10End of Topic Test - Transcription & Translation
8.2.11Tumours
8.2.12Correlations & Causes
8.2.13Prevention & Treatment
8.2.14End of Topic Test - Cancer
8.2.15A-A* (AO3/4) - Gene Expression & Cancer
8.3Genome Projects
Unlock your full potential with GoStudent tutoring
Affordable 1:1 tutoring from the comfort of your home
Tutors are matched to your specific learning needs
30+ school subjects covered