3.3.5
Practical Graphs
Test your knowledge with free interactive questions on Seneca — used by over 10 million students.
Distance-Time Graphs
Distance-time graphs plot the distance travelled against the time. The gradient of a distance-time graph represents the speed (velocity) and direction of movement.

Gradient
- Steeper gradients mean faster speed and a negative gradient means the object is travelling back towards the start.
- If the graph is flat the object is stationary.
Calculating speed
- To calculate the speed from a distance-time graph, work out the distance travelled and the time taken for that section and calculate:
- Speed = distance ÷ time
Velocity-Time Graphs
Velocity-time graphs plot the velocity against the time.

Velocity
- Velocity is speed measured in a particular direction.
- Two objects travelling in opposite directions at a speed of 10km/h would have velocities of 10km/h and -10km/h.

Gradient and area
- The gradient in a velocity-time graph represents acceleration.
- The area under the graph is the total distance travelled.
- When the graph is flat the velocity is constant.
- Steeper gradients mean stronger acceleration and negative slopes mean deceleration.
Conversion Graphs
Straight line graphs can be used to convert between different units of measurement.

Drawing conversion graphs
- Conversion graphs can be constructed from tables of two different units of the same measurement.
- The table above shows several distances measured in miles and the same distance measured in kilometres.

Drawing conversion graphs 2
- To draw the conversion graph for kilometres-miles, plot these values on a graph.
- Draw a straight line from the origin that connects all of the points.
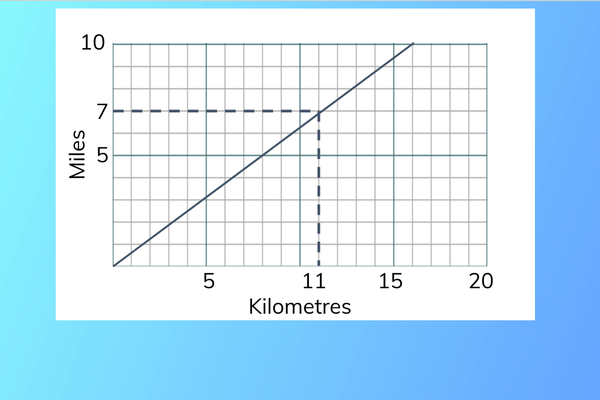
Using conversion graphs
- To use the conversion graph, draw a line from the value you want to convert to the conversion line.
- Converting 7 miles gives approximately 11 km and vice versa.
1Numbers
1.1Integers
1.3Decimals
1.4Powers & Roots
1.5Set Language & Notation
1.6Percentages
1.7Ratio & Proportion
2Equations, Formulae & Identities
2.1Algebraic Manipulation
2.2Expressions & Formulae
2.3Linear Equations
2.4Quadratic Equations
2.5Proportion
3Sequences, Functions & Graphs
3.1Sequences
3.3Graphs
3.4Common Graphs
4Geometry
4.1Angles, Lines & Triangles
4.2Polygons
4.5Circle Properties
4.6Trigonometry & Pythagoras’ theorem
4.7Mensuration of 2D Shapes
4.83D Shapes & Volume
5Vectors & Transformation Geometry
6Statistics & Probability
6.1Statistical Measures
6.2Graphical Representation of Data
Jump to other topics
1Numbers
1.1Integers
1.3Decimals
1.4Powers & Roots
1.5Set Language & Notation
1.6Percentages
1.7Ratio & Proportion
2Equations, Formulae & Identities
2.1Algebraic Manipulation
2.2Expressions & Formulae
2.3Linear Equations
2.4Quadratic Equations
2.5Proportion
3Sequences, Functions & Graphs
3.1Sequences
3.3Graphs
3.4Common Graphs
4Geometry
4.1Angles, Lines & Triangles
4.2Polygons
4.5Circle Properties
4.6Trigonometry & Pythagoras’ theorem
4.7Mensuration of 2D Shapes
4.83D Shapes & Volume
5Vectors & Transformation Geometry
6Statistics & Probability
6.1Statistical Measures
6.2Graphical Representation of Data
Practice questions on Practical Graphs
Can you answer these? Test yourself with free interactive practice on Seneca — used by over 10 million students.
- 1What is the equation for speed?Multiple choice
- 2What can we tell from the gradient of a distance-time graph?Fill in the list
- 3
- 4
- 5
Unlock your full potential with Seneca Premium
Unlimited access to 10,000+ open-ended exam questions
Mini-mock exams based on your study history
Unlock 800+ premium courses & e-books