3.1.5
Conversion Graph
Conversion Graphs
Conversion Graphs
Straight line graphs can be used to convert between different units of measurement.


Drawing conversion graphs
Drawing conversion graphs
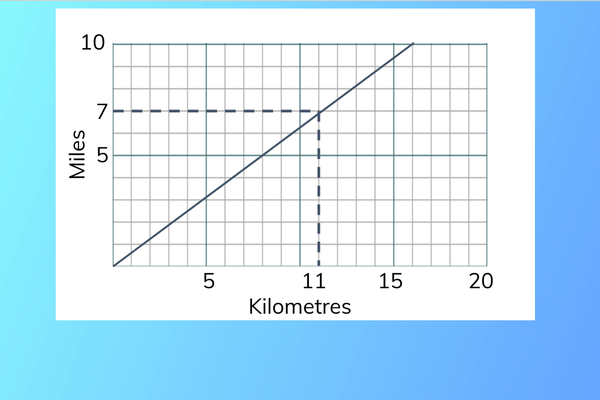
- Conversion graphs can be constructed from tables of two different units of the same measurement.
- The table above shows several distances measured in miles and the same distance measured in kilometres.


Drawing conversion graphs 2
Drawing conversion graphs 2
- To draw the conversion graph for kilometres-miles, plot these values on a graph.
- Draw a straight line from the origin that connects all of the points.


Using conversion graphs
Using conversion graphs
- To use the conversion graph, draw a line from the value you want to convert to the conversion line.
- Converting 7 miles gives approximately 11 km and vice versa.
1Proof
1.1Types of Numbers
1.2Notation
2Algebra & Functions
2.1Powers & Roots
2.2Quadratic Equations
2.3Inequalities
2.4Polynomials
2.5Graphs
2.7Transformation of Graphs
3Coordinate Geometry
3.1Straight Lines
3.2Circles
3.2.1Equations of Circles centred at Origin
3.2.2Finding the Centre & Radius
3.2.3Equation of a Tangent
3.2.4Circle Theorems - Perpendicular Bisector
3.2.5Circle Theorems - Angle at the Centre
3.2.6Circle Theorems - Angle at a Semi-Circle
3.2.7Equation of a Perpendicular Bisector
3.2.8Equation of a Circumcircle
3.2.9Circumcircle of a Right-angled Triangle
3.3Parametric Equations (A2 only)
4Sequences & Series
4.1Binomial Expansion
5Trigonometry
5.2Trigonometric Functions
5.3Triangle Rules
6Exponentials & Logarithms
6.1Exponentials & Logarithms
7Differentiation
7.1Derivatives
7.2Graphs & Differentiation
7.3Differentiation With Trigonometry and Exponentials
7.4Rules of Differetiation (A2 only)
7.5Parametric & Implicit Differentiation
8Integration
8.1Integration
9Numerical Methods
9.1Finding Solutions
9.2Finding the Area
10Vectors
10.12D Vectors
10.23D Vectors
10.3Vector Proofs
Jump to other topics
1Proof
1.1Types of Numbers
1.2Notation
2Algebra & Functions
2.1Powers & Roots
2.2Quadratic Equations
2.3Inequalities
2.4Polynomials
2.5Graphs
2.7Transformation of Graphs
3Coordinate Geometry
3.1Straight Lines
3.2Circles
3.2.1Equations of Circles centred at Origin
3.2.2Finding the Centre & Radius
3.2.3Equation of a Tangent
3.2.4Circle Theorems - Perpendicular Bisector
3.2.5Circle Theorems - Angle at the Centre
3.2.6Circle Theorems - Angle at a Semi-Circle
3.2.7Equation of a Perpendicular Bisector
3.2.8Equation of a Circumcircle
3.2.9Circumcircle of a Right-angled Triangle
3.3Parametric Equations (A2 only)
4Sequences & Series
4.1Binomial Expansion
5Trigonometry
5.2Trigonometric Functions
5.3Triangle Rules
6Exponentials & Logarithms
6.1Exponentials & Logarithms
7Differentiation
7.1Derivatives
7.2Graphs & Differentiation
7.3Differentiation With Trigonometry and Exponentials
7.4Rules of Differetiation (A2 only)
7.5Parametric & Implicit Differentiation
8Integration
8.1Integration
9Numerical Methods
9.1Finding Solutions
9.2Finding the Area
10Vectors
10.12D Vectors
10.23D Vectors
10.3Vector Proofs
Unlock your full potential with Seneca Premium
Unlimited access to 10,000+ open-ended exam questions
Mini-mock exams based on your study history
Unlock 800+ premium courses & e-books