3.1.5
Conversion Graph
Test your knowledge with free interactive questions on Seneca — used by over 10 million students.
Conversion Graphs
Straight line graphs can be used to convert between different units of measurement.

Drawing conversion graphs
- Conversion graphs can be constructed from tables of two different units of the same measurement.
- The table above shows several distances measured in miles and the same distance measured in kilometres.

Drawing conversion graphs 2
- To draw the conversion graph for kilometres-miles, plot these values on a graph.
- Draw a straight line from the origin that connects all of the points.
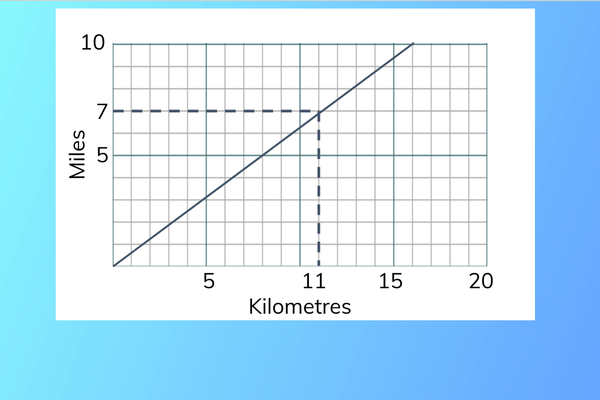
Using conversion graphs
- To use the conversion graph, draw a line from the value you want to convert to the conversion line.
- Converting 7 miles gives approximately 11 km and vice versa.
1Proof
1.1Types of Numbers
1.2Notation
2Algebra & Functions
2.1Powers & Roots
2.2Quadratic Equations
2.3Inequalities
2.4Polynomials
2.5Graphs
2.7Transformation of Graphs
3Coordinate Geometry
3.1Straight Lines
3.2Circles
3.2.1Equations of Circles centred at Origin3.2.2Finding the Centre & Radius3.2.3Equation of a Tangent3.2.4Circle Theorems - Perpendicular Bisector3.2.5Circle Theorems - Angle at the Centre3.2.6Circle Theorems - Angle at a Semi-Circle3.2.7Equation of a Perpendicular Bisector3.2.8Equation of a Circumcircle3.2.9Circumcircle of a Right-angled Triangle
3.3Parametric Equations (A2 only)
4Sequences & Series
4.1Binomial Expansion
5Trigonometry
5.2Trigonometric Functions
5.3Triangle Rules
6Exponentials & Logarithms
6.1Exponentials & Logarithms
7Differentiation
7.1Derivatives
7.2Graphs & Differentiation
7.3Differentiation With Trigonometry and Exponentials
7.4Rules of Differetiation (A2 only)
7.5Parametric & Implicit Differentiation
8Integration
8.1Integration
9Numerical Methods
9.1Finding Solutions
9.2Finding the Area
10Vectors
10.12D Vectors
10.23D Vectors
10.3Vector Proofs
Jump to other topics
1Proof
1.1Types of Numbers
1.2Notation
2Algebra & Functions
2.1Powers & Roots
2.2Quadratic Equations
2.3Inequalities
2.4Polynomials
2.5Graphs
2.7Transformation of Graphs
3Coordinate Geometry
3.1Straight Lines
3.2Circles
3.2.1Equations of Circles centred at Origin3.2.2Finding the Centre & Radius3.2.3Equation of a Tangent3.2.4Circle Theorems - Perpendicular Bisector3.2.5Circle Theorems - Angle at the Centre3.2.6Circle Theorems - Angle at a Semi-Circle3.2.7Equation of a Perpendicular Bisector3.2.8Equation of a Circumcircle3.2.9Circumcircle of a Right-angled Triangle
3.3Parametric Equations (A2 only)
4Sequences & Series
4.1Binomial Expansion
5Trigonometry
5.2Trigonometric Functions
5.3Triangle Rules
6Exponentials & Logarithms
6.1Exponentials & Logarithms
7Differentiation
7.1Derivatives
7.2Graphs & Differentiation
7.3Differentiation With Trigonometry and Exponentials
7.4Rules of Differetiation (A2 only)
7.5Parametric & Implicit Differentiation
8Integration
8.1Integration
9Numerical Methods
9.1Finding Solutions
9.2Finding the Area
10Vectors
10.12D Vectors
10.23D Vectors
10.3Vector Proofs
Practice questions on Conversion Graph
Can you answer these? Test yourself with free interactive practice on Seneca — used by over 10 million students.
- 1What is $6.00 in pounds?Multiple choice
- 2What is £10.00 in dollars?Multiple choice
- 3What is $15.00 in pounds?Multiple choice
- 4What is 13 km in miles?Multiple choice
- 5What is 6 miles in km?Multiple choice
Unlock your full potential with Seneca Premium
Unlimited access to 10,000+ open-ended exam questions
Mini-mock exams based on your study history
Unlock 800+ premium courses & e-books