


Positive Correlation Between Seneca Usage & Grades at Erasmus Darwin Academy
A brand new case study comparing performance between Seneca students and their peers. This one comes from Miss Lauren Wright, Teacher of Geography and Lead of PSHE at Erasmus Darwin Academy.
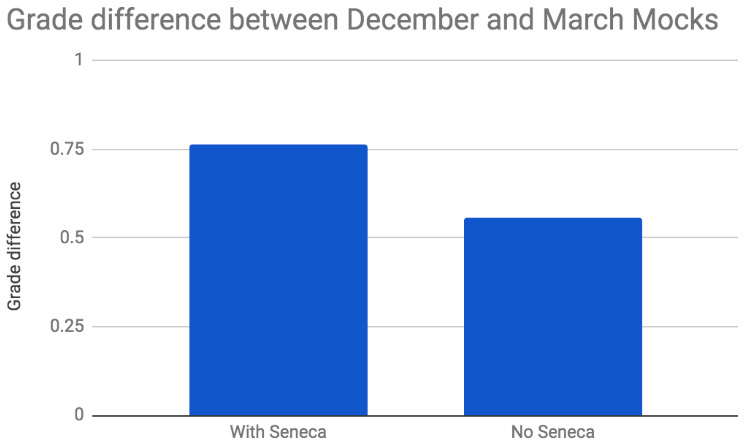
She computed the grade difference between December Mocks and March Mocks for her 110 Year 11 students.
Then, she compared the average difference in grades between pupils that had revised with Seneca and pupils that had not.
As you can see in the graph below, on average, all students improved from December to March, which is a great achievement anyway!
But more than that, you can see that pupils using Seneca improved even more than their colleagues who did not use the platform for revision.
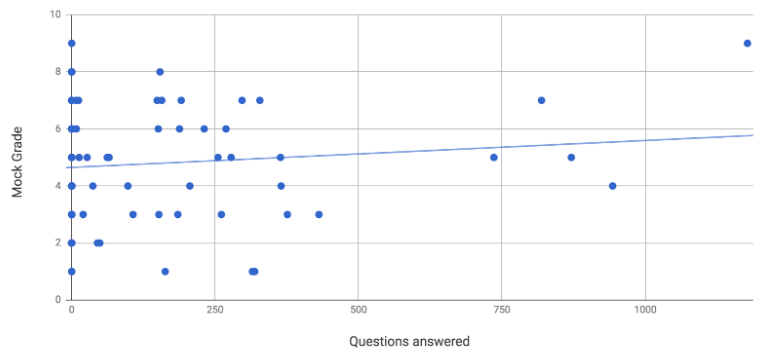
Miss Wright also correlated the March grades with the number of questions answered by her students using Seneca.
The graph below shows a positive correlation. Pupils that answered more questions on Seneca also got the best grades in their Mocks.
Well done to Erasmus Darwin Academy!
How about your school? Get in touch with Flavia (flavia@seneca.io) if you would like to check how your pupils benefit from Seneca.


