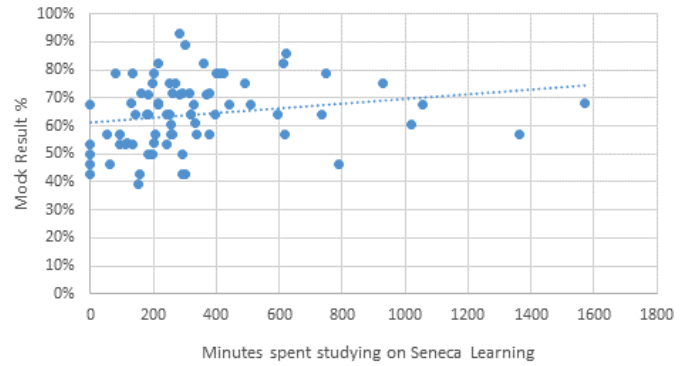

How Time Spent On Seneca Relates To Mock Outcomes At Bilborough College
Earlier this week, we received a case study from a school evaluating the impact of Seneca on their own students. Mr Simon Holland from Bilborough Sixth Form College looked into how the time spent on Seneca relates to mock outcomes.
This is the same idea that was used at Montgomery School, but now done with Year 13 pupils taking A Level mock exams.
"A positive correlation between time on Seneca and Mock marks."
The graph produced by Mr Holland shows a positive correlation between time on Seneca and Mock marks. In other words, the more students used Seneca to study, the better grades they got on the exam.

Mr Holland also reports that the overall mean mock result increased from 62.8% in 2018 to 64.2% in 2019. It is likely that this was due to the use of Seneca, which was not available for A Level last academic year.
In a more subjective view, Bilborough students show a very positive response to Seneca and find it supportive, helpful and “amazing”.
Mr Holland is going to keep monitoring the platform and students’ progress going forwards.
How To Do This For Your Classes?
You can do the same thing with your students to check the positive impact that Seneca has on their progress. All you need to do is to plot pupils’ grades against the time each of them studied with Seneca - this information you will find on your Teacher platform, by clicking on the tab “Students”. Here are links showing how to create trend lines in Excel and Google Sheets.
Also feel free to contact Flavia (flavia@seneca.io) for more guidance!


