


The Actual Impact Of Seneca On Student Grades
Last year, the Impact Journal Of The Chartered College Of Teaching published our Randomised Control Trial in which we showed the effectiveness of Seneca's learning platform compared to standard revision methods like reading textbooks.
The results of that trial suggested that "using a software platform that incorporates a blended approach of spacing, interleaving, retrieval and the use of visual cues to learn material is more effective than a spaced learning approach using a PDF of the same material, and than a massed practice approach using a printed version of the material."
Students using the software platform, now known as Seneca Learning, actually performed twice as good as students using standard methods. We also stated that we still had to investigate the impact on students' performance after a prolonged use of the software as well as when using it for multiple different subjects. And this is exactly why I'm in touch with various schools using Seneca in an attempt to gather more long-term data and the impact on students' grades.
Case Study from St John Fisher Catholic High School
Last week, Ms Anne Marie Sherwin from St John Fisher Catholic High School kindly shared her results from using Seneca for a longer period of time. She teaches GCSE Computer Science and used Mock results to investigate the relationship between time on Seneca and grades.
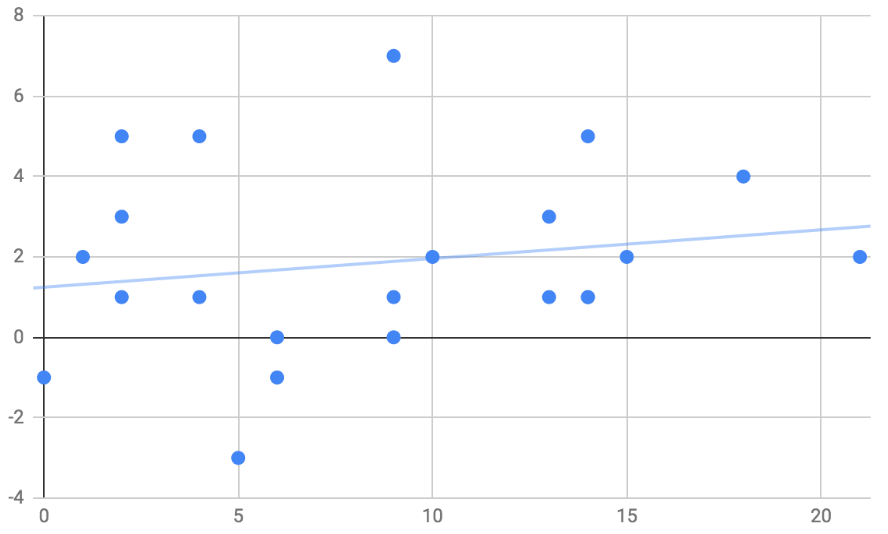
The graph below shows a correlation between the number of sessions completed on Seneca and the improvement in her Y11 students’ grades from Mock 1 to Mock 2. By the time of the first Mock, students had not yet been introduced to Seneca. The plot makes it clear that there is a positive correlation between sessions completed on Seneca and the improvement in grades.
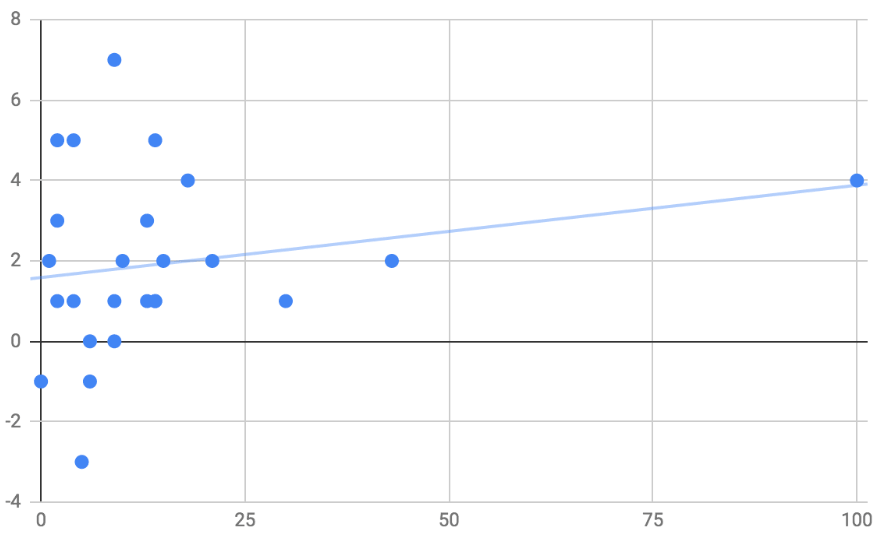
So, I assume you're now focused on the outliers, especially the pupil who completed 100 session thinking that she must be skewing the correlation up. However, even after removing the outliers the result remains very similar. Ms Sherwin said that “on the whole, students have really improved. I am really pleased”.
Case Study from Preston Manor School
Around the same time, Mr Adnan Ilahi, Business and Enterprise Coordinator at Preston Manor School in London, send me similar results. He also correlated the use of Seneca with exam grades.
Mr Ilahi reports that he has “noticed the direct improvement in students grades after using Seneca.” He gives the example of one of his students, who entered the subject getting grades 1 and 2 but now, having done over 1500 minutes on Seneca, is working her way up to grades 6 and 7.
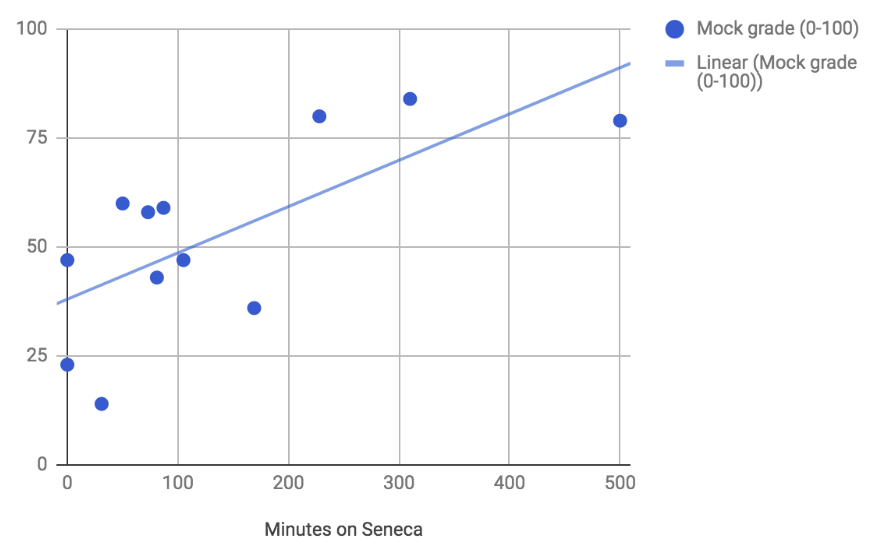
As it is visible in the graph below, students that spend more time on Seneca’s GCSE Business Studies course also perform better on the exams. Mr Ilahi concludes: “I firmly believe students who are using Seneca for Business Studies will see a direct correlation with results.”
You can create similar graph plots with your students to check the positive impact that Seneca has on their progress. All you need to do is to plot pupils’ grades against the time each of them studied with Seneca - this information you will find on your Teacher platform, by clicking on the tab “Students”. Here are links showing how to create trend lines in Excel and Google Sheets.
Also feel free to contact me at flavia@seneca.io for more guidance!


