
How Leaderboards Increase Student Engagement
When building Seneca, one of our premises was to make studying as engaging as possible. For that reason, all our revision courses contain dynamic texts, videos, gifs and memory palaces. However, we’ve seen that one of the key drivers for students to study more is actually their position on the leaderboard. This is quite an interesting finding for how to increase engagement in your classroom. I'll get to that, but let me first explain what Seneca's leaderboards do.
How to Let Your Students Compete on Seneca Learning
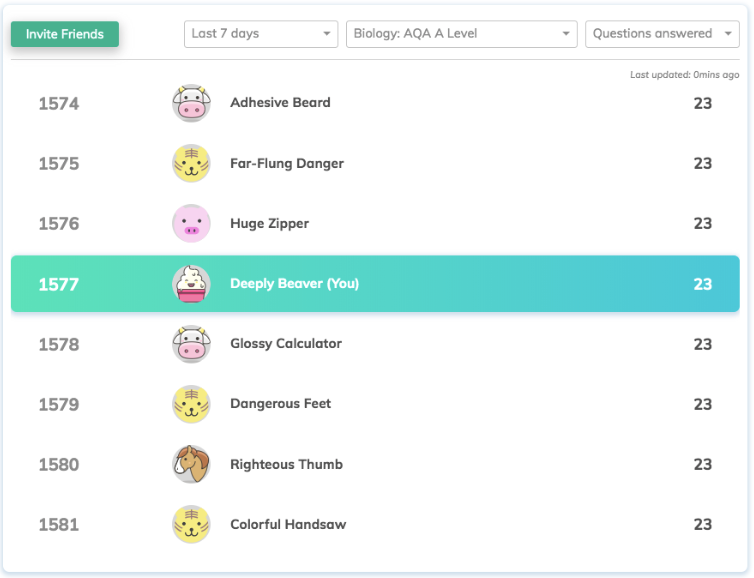
Each student can invite their friends to his/her study leaderboard. The leaderboard displays how many questions were answered across the student’s revision courses, as well as their total study time and the number of sessions that were completed. Students can compete against their friends to get a higher score, and although you might not think that this is what friends do, we have seen a significant percentage of users inviting others. Surprisingly.
In-Class Study Competitions
Unfortunately, the leaderboards have not been made available to teachers to create a custom leaderboard for their class. Not yet at least. This requires more time from our engineering team and until now we had to prioritise different features such as the homework assignments.
Nevertheless, we already frequently receive pictures and message from teachers that use Seneca for in-class competitions. We asked these teachers how they handle the administrative task of tracking what student progressed the most.
Turns out that these teachers simply copied the learning time, questions answered and sessions completed per student into an Excel or Google sheet. This is of course not ideal, and we're therefore considering the implementation of an exporting feature for your students’ learning insights.
To help us prioritise this teacher functionality it would help if you can share this article on Twitter and get any other teachers interested or simply send me a short message stating that this should really be added to Flavia@seneca.io.


